tags: addons, heapster
09-3.部署 heapster 插件
Heapster是一个收集者,将每个Node上的cAdvisor的数据进行汇总,然后导到第三方工具(如InfluxDB)。
Heapster 是通过调用 kubelet 的 http API 来获取 cAdvisor 的 metrics 数据的。
由于 kublet 只在 10250 端口接收 https 请求,故需要修改 heapster 的 deployment 配置。同时,需要赋予 kube-system:heapster ServiceAccount 调用 kubelet API 的权限。
下载 heapster 文件
到 heapster release 页面 下载最新版本的 heapster
1 | wget https://github.com/kubernetes/heapster/archive/v1.5.3.tar.gz |
官方文件目录: heapster-1.5.3/deploy/kube-config/influxdb
修改配置
1 | $ cd heapster-1.5.3/deploy/kube-config/influxdb |
- 开启 NodePort;
1 | $ cp heapster.yaml{,.orig} |
- 由于 kubelet 只在 10250 监听 https 请求,故添加相关参数;
1 | $ cp influxdb.yaml{,.orig} |
执行所有定义文件
1 | $ pwd |
- 将 serviceAccount kube-system:heapster 与 ClusterRole system:kubelet-api-admin 绑定,授予它调用 kubelet API 的权限;
检查执行结果
1 | $ kubectl get pods -n kube-system | grep -E 'heapster|monitoring' |
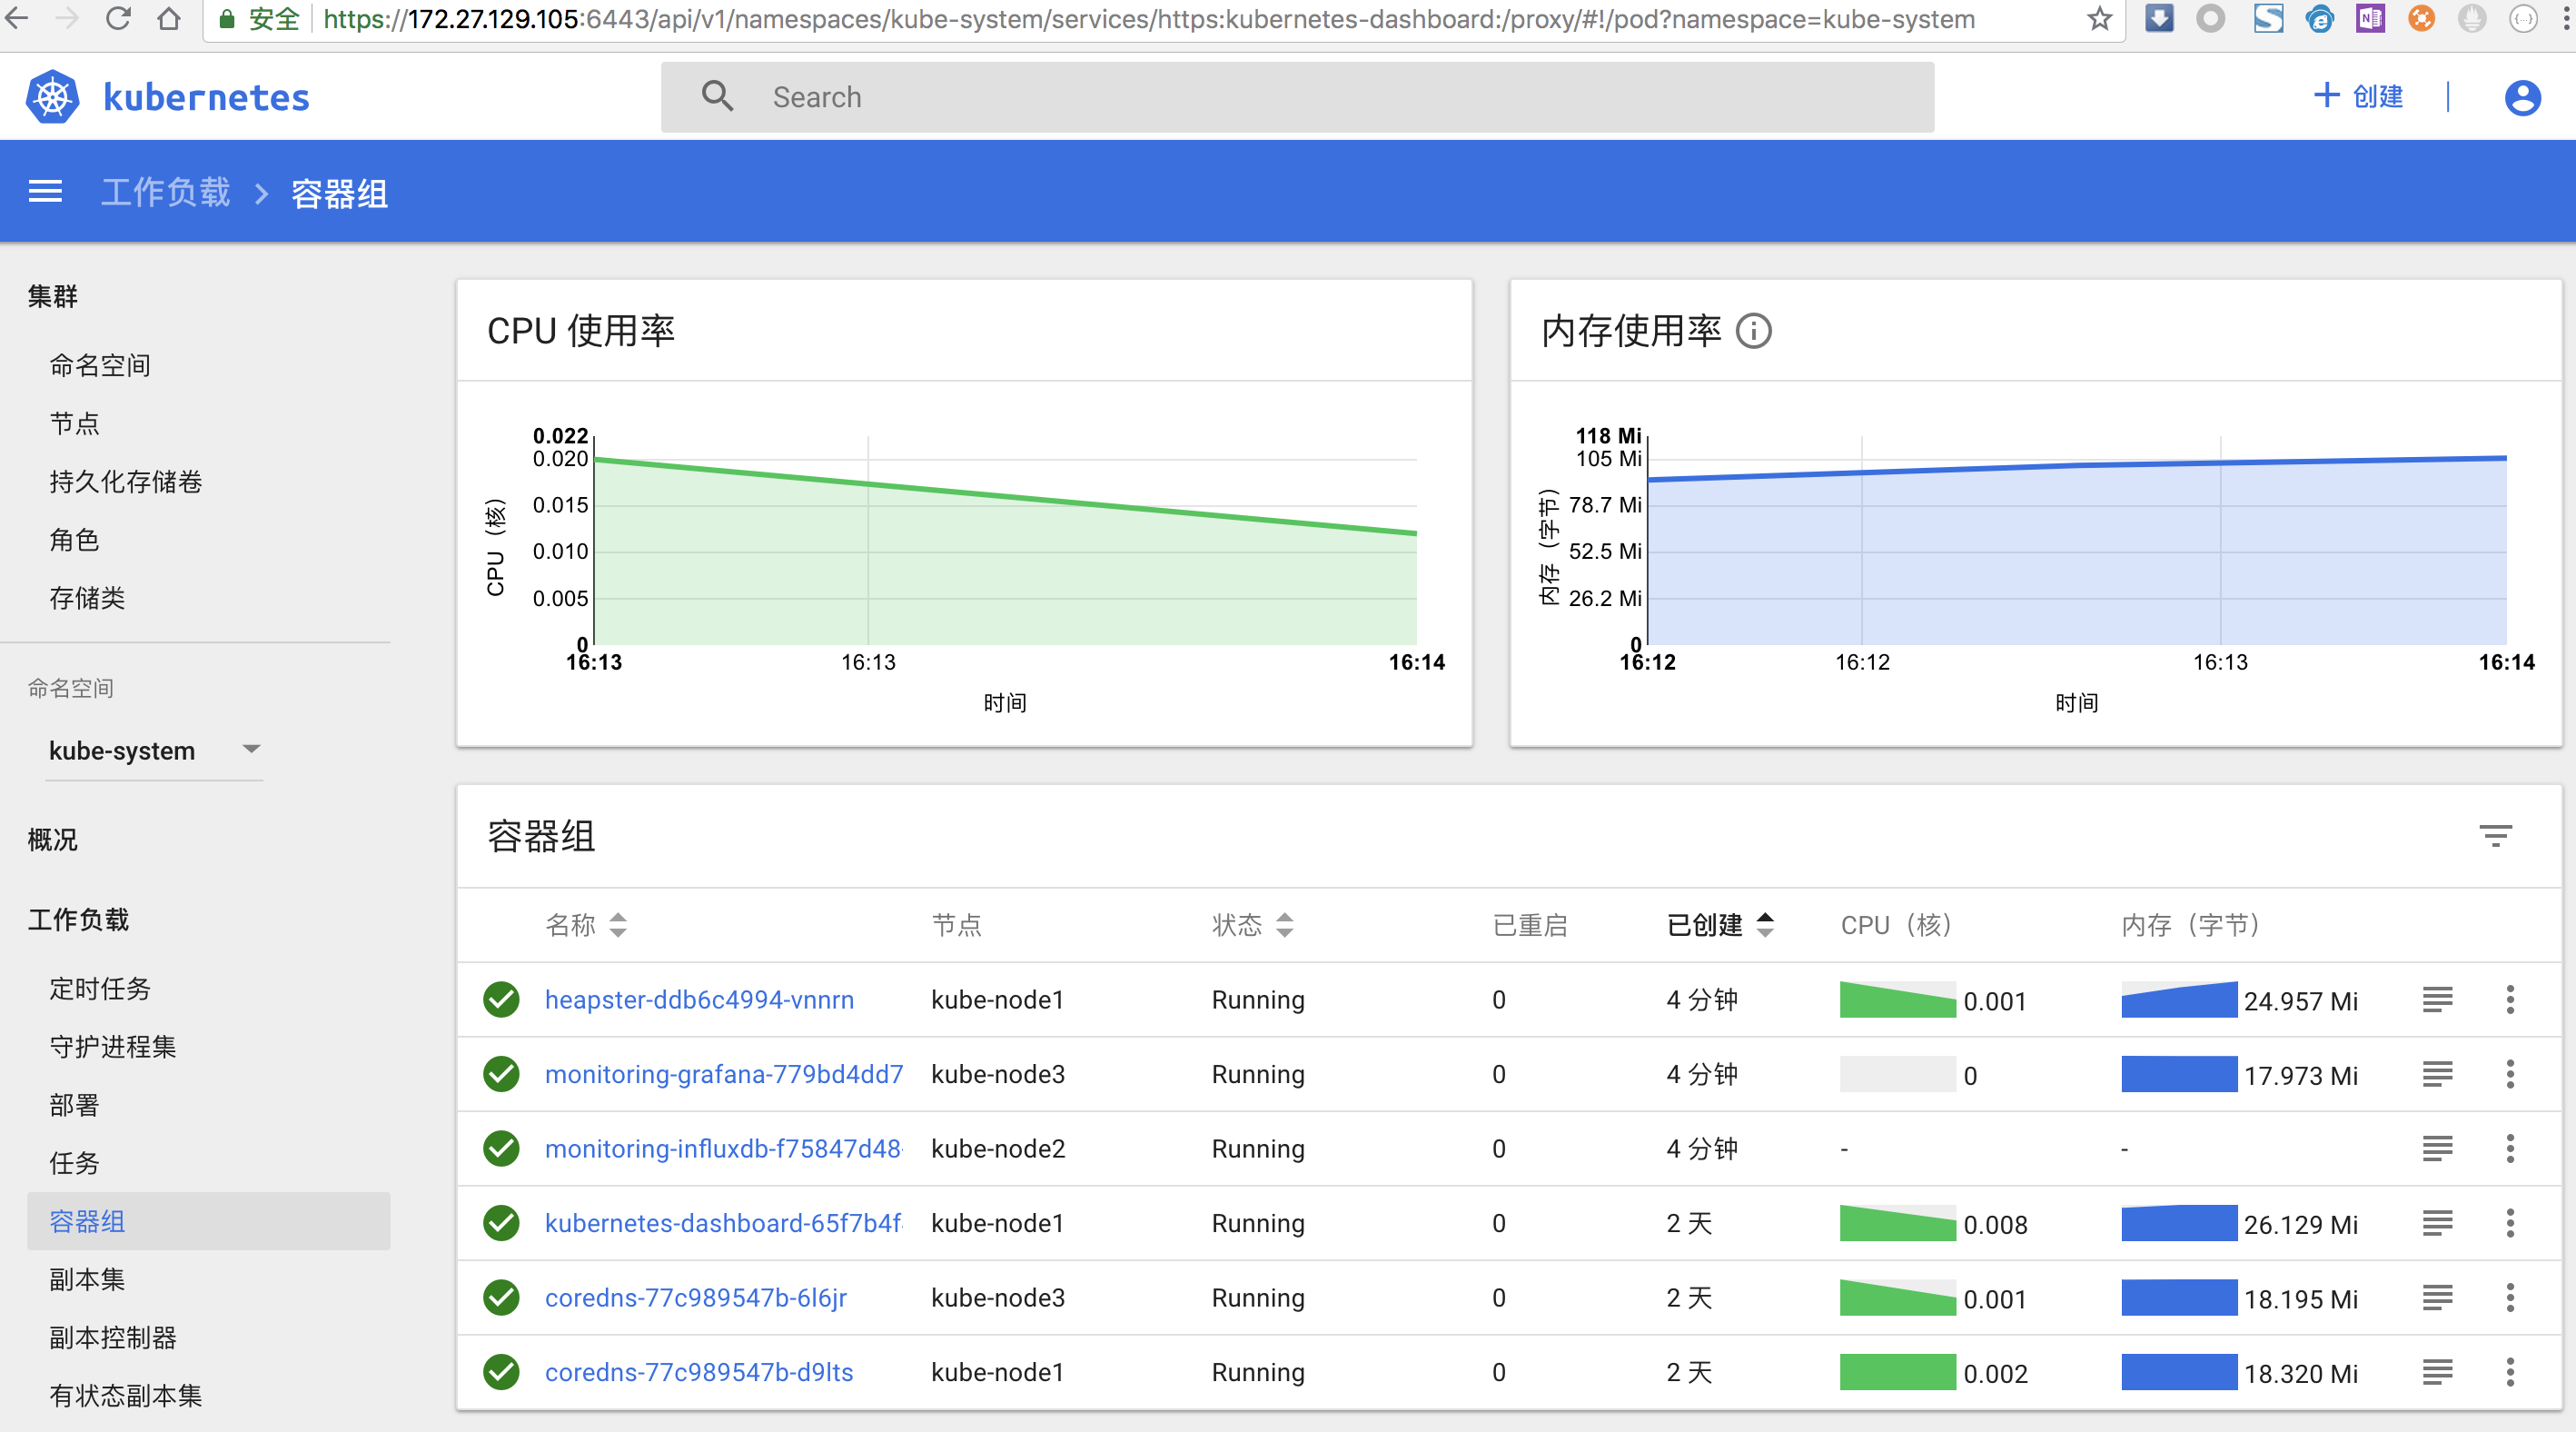
检查 kubernets dashboard 界面,可以正确显示各 Nodes、Pods 的 CPU、内存、负载等统计数据和图表:
访问 grafana
-
通过 kube-apiserver 访问:
获取 monitoring-grafana 服务 URL:
1
2
3
4
5
6
7
8
9$ kubectl cluster-info
Kubernetes master is running at https://172.27.129.105:6443
CoreDNS is running at https://172.27.129.105:6443/api/v1/namespaces/kube-system/services/coredns:dns/proxy
Heapster is running at https://172.27.129.105:6443/api/v1/namespaces/kube-system/services/heapster/proxy
kubernetes-dashboard is running at https://172.27.129.105:6443/api/v1/namespaces/kube-system/services/https:kubernetes-dashboard:/proxy
monitoring-grafana is running at https://172.27.129.105:6443/api/v1/namespaces/kube-system/services/monitoring-grafana/proxy
monitoring-influxdb is running at https://172.27.129.105:6443/api/v1/namespaces/kube-system/services/monitoring-influxdb/proxy
To further debug and diagnose cluster problems, use 'kubectl cluster-info dump'.浏览器访问 URL:
https://172.27.129.105:6443/api/v1/namespaces/kube-system/services/monitoring-grafana/proxy
对于 virtuabox 做了端口映射:https://127.0.0.1:8080/api/v1/namespaces/kube-system/services/monitoring-grafana/proxy -
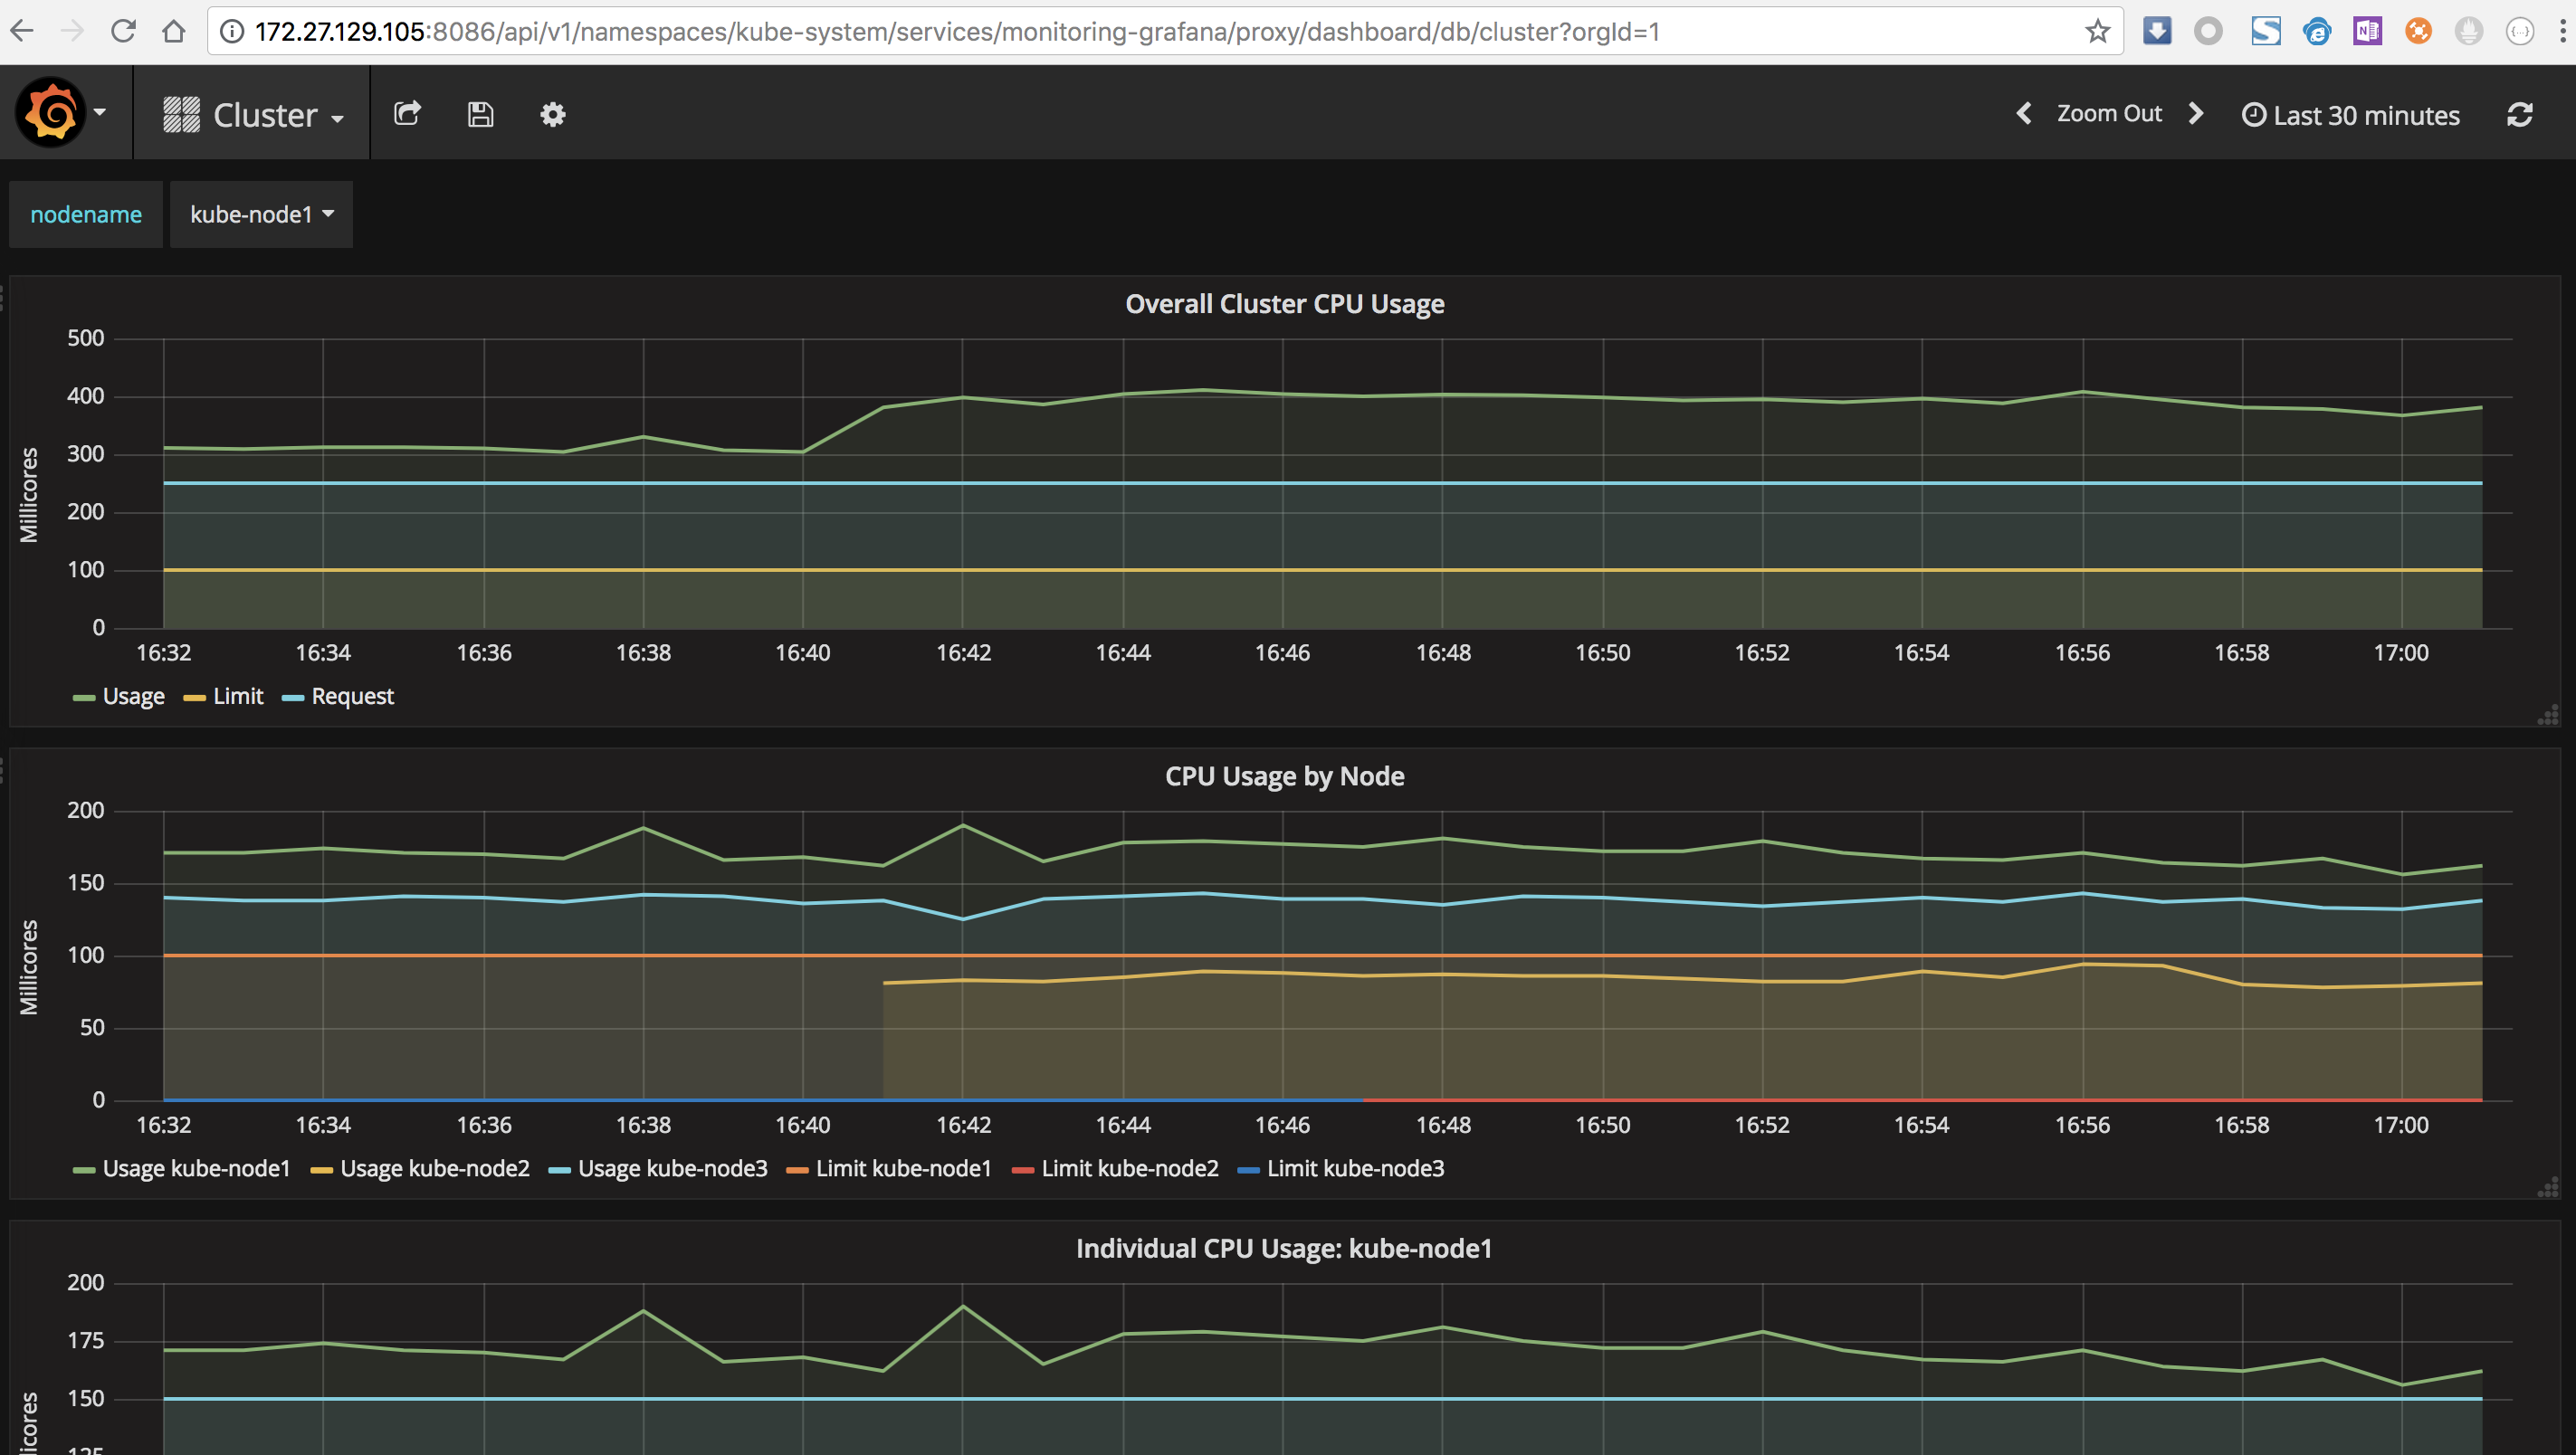
通过 kubectl proxy 访问:
创建代理
1
2kubectl proxy --address='172.27.129.105' --port=8086 --accept-hosts='^*$'
Starting to serve on 172.27.129.80:8086浏览器访问 URL:
https://172.27.129.105:8086/api/v1/namespaces/kube-system/services/monitoring-grafana/proxy/?orgId=1
对于 virtuabox 做了端口映射:https://127.0.0.1:8086/api/v1/namespaces/kube-system/services/monitoring-grafana/proxy/?orgId=1 -
通过 NodePort 访问:
1
2
3
4
$ kubectl get svc -n kube-system|grep -E 'monitoring|heapster'
heapster ClusterIP 10.254.58.136 <none> 80/TCP 47m
monitoring-grafana NodePort 10.254.28.196 <none> 80:8452/TCP 47m
monitoring-influxdb ClusterIP 10.254.138.164 <none> 8086/TCP 47m-
grafana 监听 NodePort 8452;
浏览器访问 URL:
https://172.27.129.105:8452/?orgId=1
-
参考: